
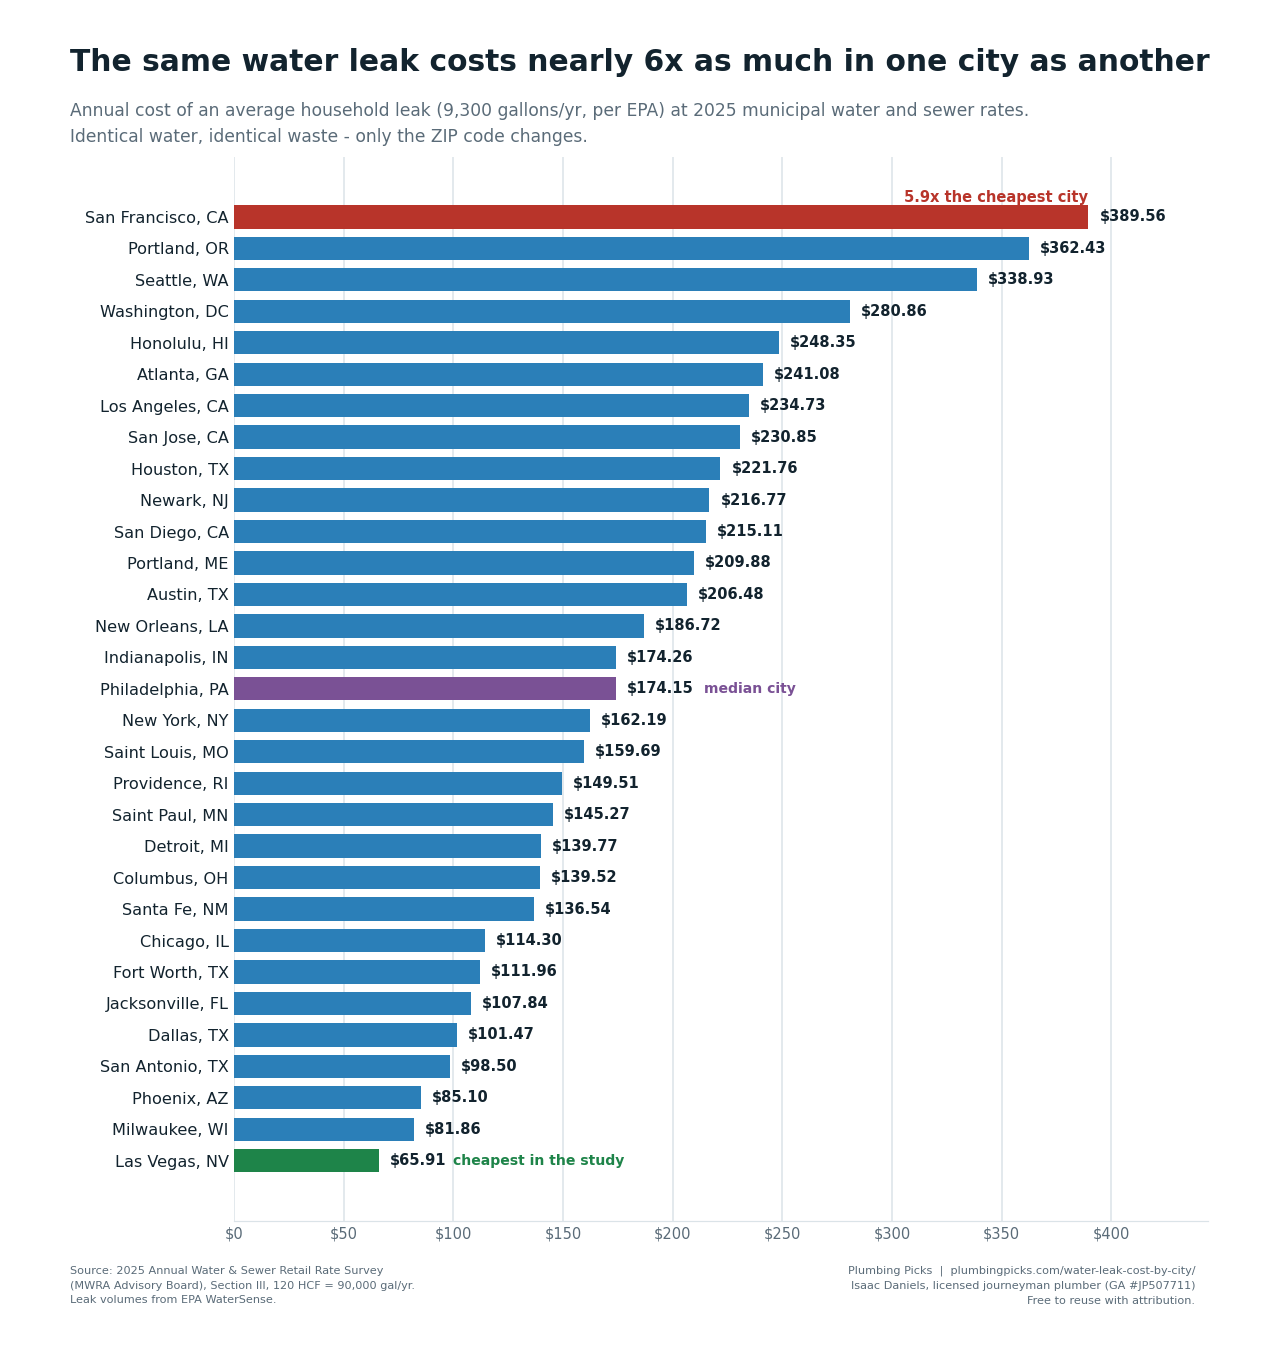
A household leak that costs $65.91 a year in Las Vegas, NV costs $389.56 a year in San Francisco, CA. Same leak. Same wasted water. The only thing that changes is what your city charges for it.
The EPA says the average American home leaks more than 9,300 gallons a year, and that nationwide we waste close to a trillion gallons annually through leaks alone. Those are good numbers, but they’re gallons — and gallons don’t motivate anybody. So I took the EPA’s leak volumes and priced them against the actual 2025 water and sewer rates in 31 major U.S. cities.
As far as I can find, nobody has published this particular calculation. Every number below traces back to one of two public sources, and nothing is estimated — where the source data had a gap, I say so. Full methodology is at the bottom.
The headline numbers
- Water and sewer costs vary 5.9× across major U.S. cities — from $637.88 a year in Las Vegas, NV to $3,769.92 in San Francisco, CA, for identical household usage.
- The average household leak costs $174.15 a year at the median city rate, $65.91 in Las Vegas, NV, and $389.56 in San Francisco, CA.
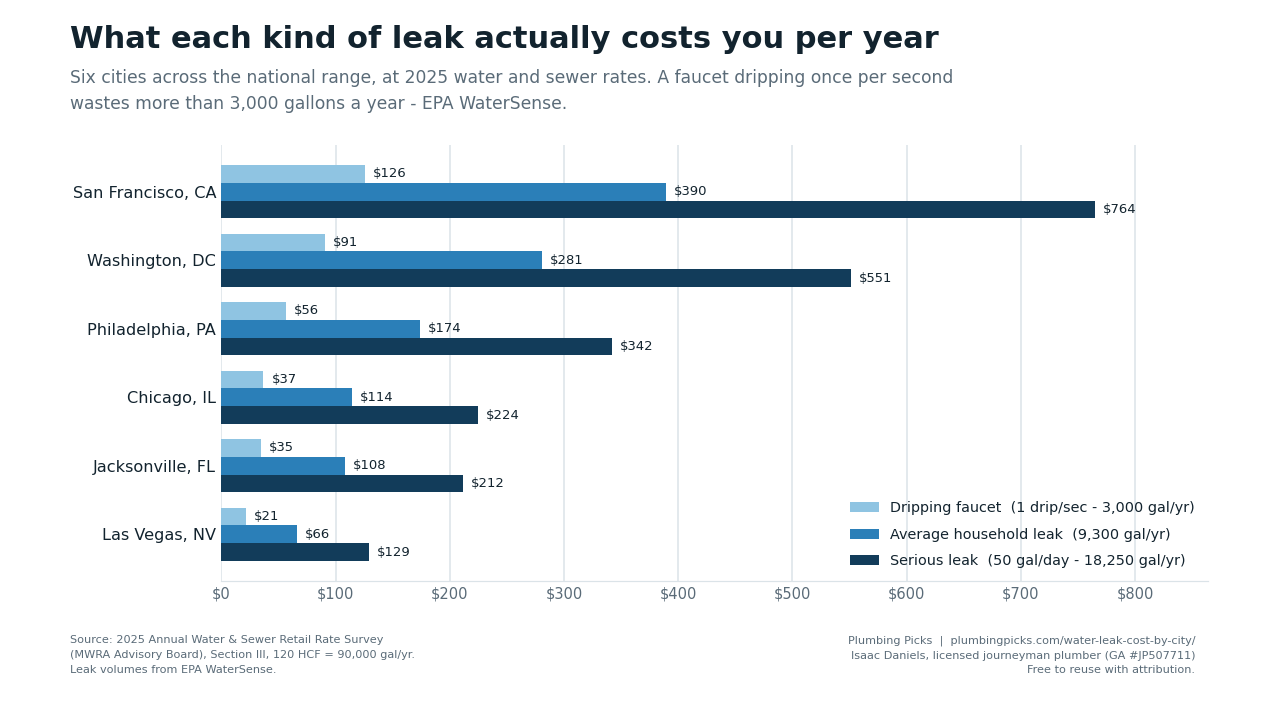
- A single faucet dripping once per second costs $21.26 to $125.66 a year depending on the city.
- The 9% of U.S. homes the EPA says are losing 50 gallons a day or more are paying $129.35 to $764.46 a year for it.
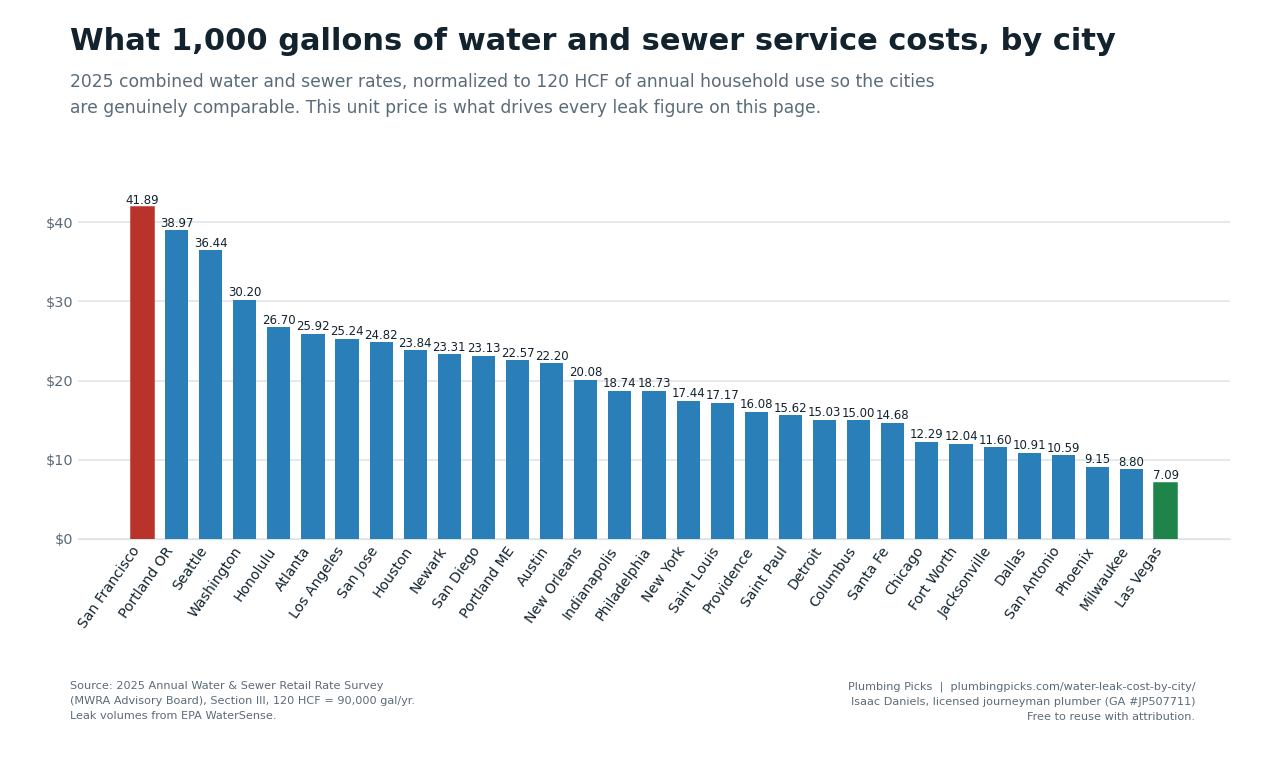
- Three of the five most expensive cities are on the West Coast. San Francisco, CA, Portland, OR and Seattle, WA all charge more than $30.00 per 1,000 gallons — more than four times what Las Vegas, NV charges.
Combined water + sewer rate, 31 U.S. cities, 2025 rate schedules. Atlanta highlighted.
San Francisco charges 5.9× what Las Vegas charges for the same 1,000 gallons. Chart: Plumbing Picks. Data: MWRA Advisory Board 2025 Annual Water and Sewer Retail Rate Survey.
What a leak costs, city by city
All figures are annual and in 2025 dollars, and include both the water you buy and the sewer charge you pay to send it back down the drain. Sorted most to least expensive.
| # | City | Annual water + sewer bill | Cost per 1,000 gallons | Average household leak (9,300 gal/yr) | Dripping faucet (3,000 gal/yr) | Serious leak (50 gal/day) |
|---|---|---|---|---|---|---|
| 1 | San Francisco, CA | $3,769.92 | $41.89 | $389.56 | $125.66 | $764.46 |
| 2 | Portland, OR | $3,507.34 | $38.97 | $362.43 | $116.91 | $711.21 |
| 3 | Seattle, WA | $3,280.00 | $36.44 | $338.93 | $109.33 | $665.11 |
| 4 | Washington, DC | $2,718.00 | $30.20 | $280.86 | $90.60 | $551.15 |
| 5 | Honolulu, HI | $2,403.42 | $26.70 | $248.35 | $80.11 | $487.36 |
| 6 | Atlanta, GA | $2,333.04 | $25.92 | $241.08 | $77.77 | $473.09 |
| 7 | Los Angeles, CA | $2,271.54 | $25.24 | $234.73 | $75.72 | $460.62 |
| 8 | San Jose, CA | $2,234.08 | $24.82 | $230.85 | $74.47 | $453.02 |
| 9 | Houston, TX | $2,146.02 | $23.84 | $221.76 | $71.53 | $435.17 |
| 10 | Newark, NJ | $2,097.77 | $23.31 | $216.77 | $69.93 | $425.38 |
| 11 | San Diego, CA | $2,081.70 | $23.13 | $215.11 | $69.39 | $422.12 |
| 12 | Portland, ME | $2,031.12 | $22.57 | $209.88 | $67.70 | $411.87 |
| 13 | Austin, TX | $1,998.18 | $22.20 | $206.48 | $66.61 | $405.19 |
| 14 | New Orleans, LA | $1,806.99 | $20.08 | $186.72 | $60.23 | $366.42 |
| 15 | Indianapolis, IN | $1,686.43 | $18.74 | $174.26 | $56.21 | $341.97 |
| 16 | Philadelphia, PA | $1,685.28 | $18.73 | $174.15 | $56.18 | $341.74 |
| 17 | New York, NY | $1,569.54 | $17.44 | $162.19 | $52.32 | $318.27 |
| 18 | Saint Louis, MO | $1,545.40 | $17.17 | $159.69 | $51.51 | $313.37 |
| 19 | Providence, RI | $1,446.85 | $16.08 | $149.51 | $48.23 | $293.39 |
| 20 | Saint Paul, MN | $1,405.80 | $15.62 | $145.27 | $46.86 | $285.06 |
| 21 | Detroit, MI | $1,352.64 | $15.03 | $139.77 | $45.09 | $274.29 |
| 22 | Columbus, OH | $1,350.24 | $15.00 | $139.52 | $45.01 | $273.80 |
| 23 | Santa Fe, NM | $1,321.38 | $14.68 | $136.54 | $44.05 | $267.95 |
| 24 | Chicago, IL | $1,106.10 | $12.29 | $114.30 | $36.87 | $224.29 |
| 25 | Fort Worth, TX | $1,083.48 | $12.04 | $111.96 | $36.12 | $219.71 |
| 26 | Jacksonville, FL | $1,043.57 | $11.60 | $107.84 | $34.79 | $211.61 |
| 27 | Dallas, TX | $981.96 | $10.91 | $101.47 | $32.73 | $199.12 |
| 28 | San Antonio, TX | $953.24 | $10.59 | $98.50 | $31.77 | $193.30 |
| 29 | Phoenix, AZ† | $823.53 | $9.15 | $85.10 | $27.45 | $166.99 |
| 30 | Milwaukee, WI | $792.20 | $8.80 | $81.86 | $26.41 | $160.64 |
| 31 | Las Vegas, NV | $637.88 | $7.09 | $65.91 | $21.26 | $129.35 |
What this means if you own a house
I’ve been a licensed plumber in Georgia for years, and the thing that surprises homeowners most is how ordinary the expensive leaks are. Nobody calls me about a dramatic burst pipe and then discovers it cost them $200 quietly over a year. It’s the flapper valve in the toilet tank. It’s the supply line under the sink with a slow weep. It’s the outdoor spigot that never quite shuts.
Here in Atlanta, where combined water and sewer runs $25.92 per 1,000 gallons, the average household leak is costing $241.08 a year — and a $12 flapper fixes most of them in about ten minutes.
The test takes two minutes and costs nothing: shut off every fixture and appliance in the house, then look at your water meter. If the dial is still moving, you’re losing water somewhere. For toilets specifically, put a few drops of food coloring in the tank and come back in fifteen minutes — if there’s color in the bowl and nobody flushed, the flapper is done.
If you want your own number rather than your city’s average, the free water leak cost calculator turns a drip rate into a dollar figure using your own water rate.
What to do about it. The cheapest fix is catching the leak early: start with why your water bill is so high and the two-minute meter test. If you would rather the house catch it for you, a smart leak detector with automatic shut-off closes the main line before the gallons add up.
Methodology
Why this study exists. The most widely cited city-level water rate comparison in the United States, Circle of Blue’s annual Price of Water survey, last published in 2019 — its public dataset covers 2010 to 2019 rates in 30 major cities. I could not find a comparable primary-source survey that replaced it. For seven years, anyone asking what water actually costs in a specific American city has been working from state-level averages. This is an attempt to fill that gap with 2025 rate schedules read directly from the utilities’ own published tariffs.
Rates. Every water and sewer figure comes from Section III of the 2025 Annual Water and Sewer Retail Rate Survey published by the MWRA Advisory Board, which surveys 31 major U.S. cities each year. All city bills are computed on the same basis the survey uses — the AWWA Standard for Historical Comparison, 120 HCF (about 90,000 gallons) of annual household usage — so the cities are directly comparable to each other.
Cost per 1,000 gallons. Each city’s combined annual bill divided by 90, since 90,000 gallons is 90 thousand-gallon units. This is an average rate across the whole bill, and it therefore includes fixed service charges as well as volumetric ones.
Leak volumes. From EPA WaterSense: the average household wastes more than 9,300 gallons a year to leaks; a faucet dripping once per second wastes more than 3,000 gallons a year; and 9% of U.S. homes have leaks wasting 50 gallons a day or more, which is 18,250 gallons a year.
Leak cost. Leak volume × that city’s cost per 1,000 gallons. This treats leaked water as billed at the household’s average rate. In a city with steeply tiered pricing, leaked water lands in your highest tier and the real cost is higher than shown, so treat these as conservative figures.
Caveats, stated plainly
- Stormwater fees are excluded. The survey notes for every city that stormwater charges are not included in these rates. Several of these cities bill stormwater separately, so an actual bill can be higher than the figure shown.
- † Phoenix. The source survey’s published water ($447.47) and sewer ($379.06) figures for Phoenix sum to $826.53, but it prints a combined total of $823.53 — a $3.00 discrepancy in the source document. I’ve used the survey’s own combined figure and flagged it rather than silently correcting it.
- Four values were cross-checked arithmetically. Four figures — Chicago water, Las Vegas sewer, Saint Louis sewer, and the Austin combined total — were unreadable in the copy of the survey I first worked from and were recovered from the two figures that were present; the survey’s final PDF prints all four, and they match. Every one of them is a simple sum or difference of published numbers, not an estimate.
- Sewer charges are usually billed on water volume. In most of these cities a leak that never reaches the drain is still billed sewer volume, which is why sewer is included here. A few utilities cap or adjust sewer volume seasonally; check your own bill.
- This is a household-average comparison, not your bill. Rates vary by usage tier, meter size, district and season within every city on this list.
Sources
- MWRA Advisory Board, 2025 Annual Water and Sewer Retail Rate Survey — Section III, Select U.S. Cities Residential 2025 Water and Sewer Charges.
- U.S. EPA WaterSense, Fix a Leak Week — household leak volumes.
Use this data
Download the raw data: water-leak-cost-by-city-2025.csv — all 31 cities, with the 2025 annual water and sewer bill, the cost per 1,000 gallons, and the derived annual cost of a dripping faucet, an average household leak and a serious leak. No signup, no email address required.
The three charts on this page are also free to republish at full size, in print or online, as long as the credit line below travels with them. Each chart has its source and this page’s address printed inside the image, so the attribution survives a screenshot.
Journalists, bloggers and utilities are welcome to republish this table or any figure in it, free of charge, with attribution to Plumbing Picks and a link to this page. If you need the underlying numbers in a spreadsheet, or a rate for a city that isn’t on this list, email me at isaac@plumbingpicks.com and I’ll send it over.
Analysis by Isaac Daniels, licensed journeyman plumber (Georgia License #JP507711), founder of Plumbing Picks. Published July 2026 using 2025 rate data.
How to cite this study
Copy whichever line fits your format.
Credit line
Source: Plumbing Picks, “What a Water Leak Actually Costs in 31 Major U.S. Cities” (2026)
APA
Daniels, I. (2026). What a Water Leak Actually Costs in 31 Major U.S. Cities (2025 rates). Plumbing Picks. https://plumbingpicks.com/water-leak-cost-by-city/
HTML embed
<p>Source: <a href="https://plumbingpicks.com/water-leak-cost-by-city/">Plumbing Picks — What a Water Leak Actually Costs in 31 Major U.S. Cities</a></p>
Using a figure in a chart or graphic? A credit to Plumbing Picks with a link to this page is all I ask.
Fix the 12 Most Common Plumbing Problems Yourself — Free Plumber’s Handbook — including how to tell if your water heater is about to fail
Step-by-step fixes for the 12 most common problems — and exactly when to call a pro. Free and instant, from a licensed plumber. Save hundreds on calls you didn’t need.